After FOMC, many trades become clear with strong n decisive movement.
AUDCAD had been trending for a while, and finally cleared 13TL.
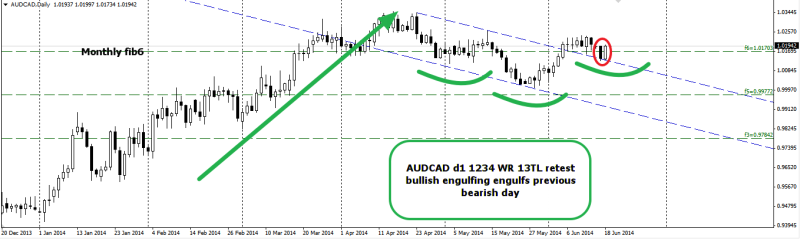
D1
Price has retested 13TL and the bounce is shown clearly with a d1 bullish engulfing candlestick.
This was done in the light of yesterday’s bearish expansion below 2 days low. Such a strong reaction warrants immediate attention.
I could also see that price has a sort of inverted head and shoulders forming.
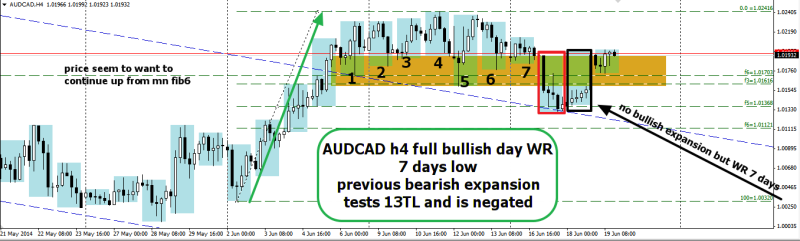
H4
H4 shows another 1234 being completed when the bullish day engulfing closed above 7 days low. There is a 1234 within 1234.
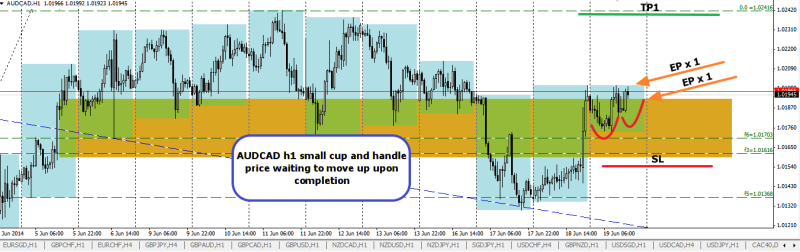
h1
I had missed out the earlier part of day to long this as I was looking at NZDCAD. However intra day price had gone on to form a cup and handle pattern, triangular flag shape pattern which i can only see it as waiting to expand upwards.
On using the monthly fib levels, i see that price has remained above this level, so if shit happens that will be my cut level.
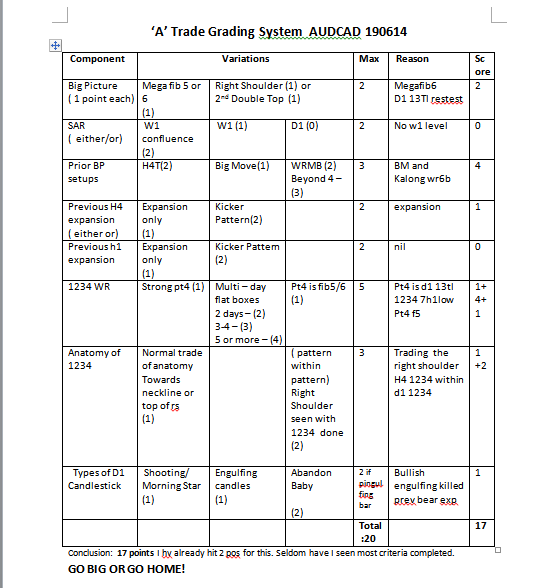
A trade criteria
17 points! GO BIG OR GO HOME! HIT IT!
edited 210614
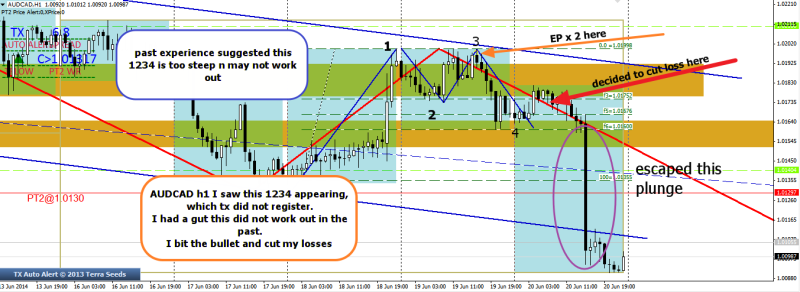
this turned out to be disastrous, as soon after I entered the big positions, price started dropping. On waking up on friday morning, price had retraced by then and I was seeing sort of a 1234, however there was a gut feel that this was the type of 1234 that would not make it.
AFI
Entry was a bad mistake, but cutting losses short before CAD news was a good choice and certainly protected my capital.
Certainly, A trade criteria needs to be reviewed. It seems that the criteria did not include/ had not placed enough emphasis on aligning the immediate h1 momentum with the big picture.
It is all about the ” h1-ness” if I wish to put in a large position. I want to see trades moving immediately, so I can shift my positions to BE immediately and have a sense of relief!


