(+100 points) week24 Dow Jones D1 shooting star from 2014 Low booking profits.

D1

Several compelling reasons to short this:

week to week still down.by going short my action signified that I was aligning momentum with trend, increasing my probability.

The shooting star was also formed by the 2014 high, hence providing a very well defined SL.

week24 Dow Jones D1 shooting star against 2014 high R 120615

Trade outcome

I shorted and took profit. I believe  there is more to go, but in week24 I kept booking  profits.  I had seen many a times when there would be a bullish day expansion against the running week to week downtrend, but yet price could continue to print a bearish day expansion. I believe I have come to this stage where I am in tune with the flow of the market most of the time.

week24 Dow Jones D1 shooting star tp gif 130615

week28 Dj30 m5 using fractal channels to get into oppoturnistic trades

h4

ON h4 price has been plunging sharply until the shape of an ed channel at h4 appears.
Tx also identifies this channel as a 1234 , giving a blue box near multi weeks low as well.

week28 DJ30 h4 quick game h4 as big picture 100714


m5

having more time on hands, i must develop and pounce on this type of opportunities where momentum is exhausted and prepares to bounce off for mean reversion.

on m5 , this chart illustrates the concept of fractals yet again, a channel within channel play.

As long as i see a price macd divergence I will have to act on it.

week28 dj30 m5 quick entry 100714

( +68 , +64, +3) week27 learnings on hidden divergence Part 2 : case study on DJ30 wr3b 1234 with hidden divergence

So tried to apply on charts and this was what I got:

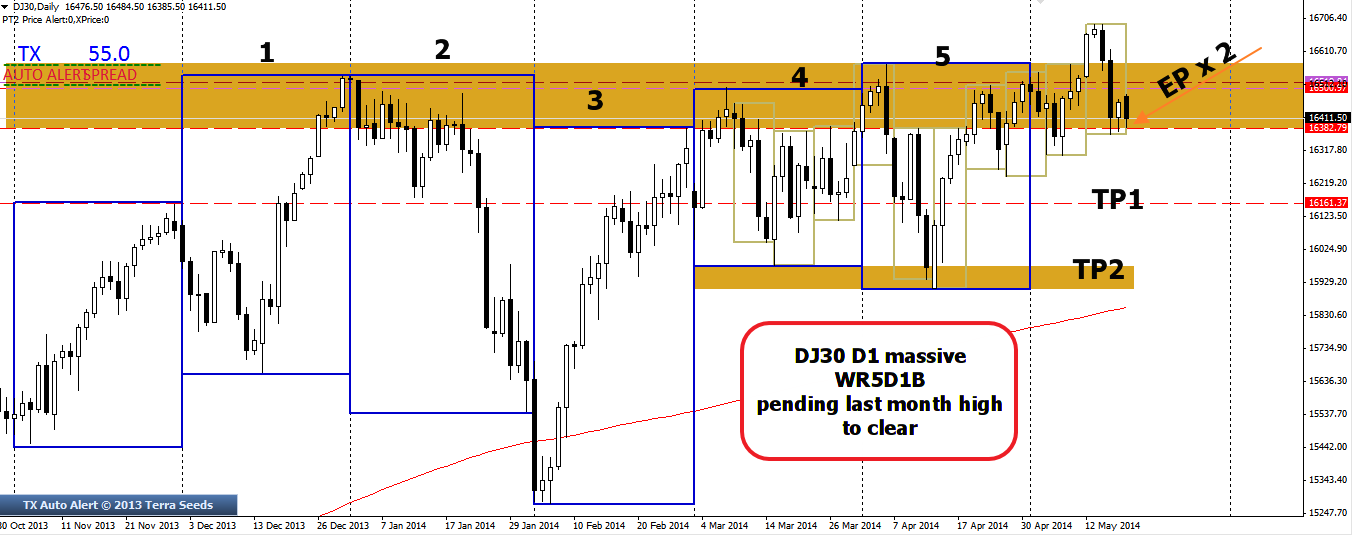
Dow Jones is uptrend. I will only look for hidden divergence on the downside of Osma.
Coincidentally, there is a potential wr2b with tx 1234.
There is a h4 bull flag as well.
This suggests there is a potential for bigger upside.

week26 D1 Dj30 awaiting hidden divergence 250614

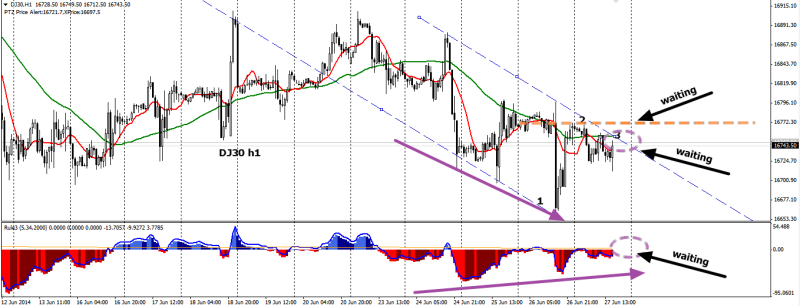
So how can I reconcile with the current h1 momentum to ensure i can go long without suffering drawdown at the initial?

I then use triggerpoint channel to get into my long,
which coincides with a h4 tx 1234 as well.

h4

h4 tx 1234 shows a promising trade

week26 DJ30 h4 wr2b devil support 270614

h1

triggerpoint provides the exact entry point and positions were triggered just before friday close.

week26 DJ30 leontey 270614

A trade criteria

( to be reviewed)

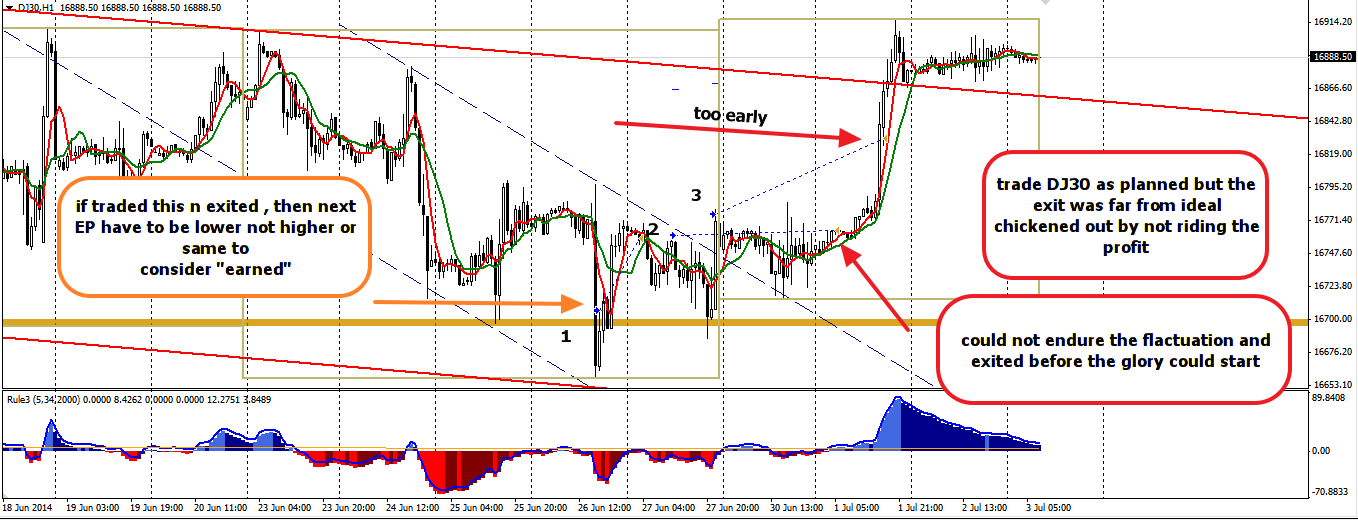
trade outcome edited 030714

On one hand, it was great to see price had indeed moved out as planned. The revised A trade criteria has improved component that worked great.
On the other hand, sticking to the plan and having conviction in my trade bias will be something to continue to work on.

From trade outcome,
it seems that this upmove was so inevitable , so sure that I would have surely made the profits but then the waiting time, the slight misttimed Entry Point made the 2 days flactuation painful such that I gave up on the day and few hours just before the glory move came.

week27 DJ30 h1 trade outcome reflection 030714

Summary

My conviction for the revised A trade criteria has increased.
But I have also identified this compulsive bad habit to be ” in the market” at most time for fear of missing out, such that ill-timed Entry Points had affected my psychological stability to hang on to the trades to see eventual success.

I must continue to work on:

RESTRAINING THE URGE TO GET INTO TRADE AT SUB-OPTIMAL PRICE

( 2 pos in progress) week21 DJ30 power bull trap over 5 months high

A clear and simple chart on D1 by my mentor put things into perspective.

Monthly

A crude and rudimentary way of projecting the top for DJ30

week21 DJ30 monthly 12=34 190514

D1

This is a massive setup.
week21 DJ30 D1 wr5D1B 190514

A trade checklist

The qn now will be : is this an A trade?

Already has 2 pos but not the best of entry. If I wish to load more, I will need to wait for a 1234 to form.

week21 DJ30 A trade checklist 190514

updated 200514

Looking at this multi day 1234 setup. Typical setup for me

week21 DJ30 multi day 1234 200514

( -70 , -80,-90 reflection on trade management) week18 DJ30 w1 shooting star, triple top and wr4b, waiting for retracement

w1

week18 DJ30 W1 shooting star 270414

Yet another shooting star on w1.

d1

1)On daily, price shows a wr4b this time, resistance clearly defined from 2013 high.
friday bearish day also signified a 3 day bull trap, creating a wr4b as well.

2) looking at latest 2 month low, that will be my profit taking zone. At the same time I will be looking for an oppoturnity to go long.

week18 DJ30 D1 wr4b 2013 still failure 260414

h4

My trade plan will be as such on Monday

week18 DJ30 h4 trade plan 270414

A trade checklist

Dj30 fits the criteria for a potential A trade. What will be lacking will be a smaller 1234 to minimize pip risk.

week18 DJ30 a trade checklist 270414

updated 300414

Trade outcome was – 70 early exit after wr4b failure , -80 , -90

Indeed most criteria were met and suggested trade was good. However shit happens. For this reflection, I choose to focus on ” had I done my best in terms of trade management and exit.”

1) one of the position could have been Tp at last week low, but greed overcame the plan and eventually all TP were put at 2 months lows.

2) could i have done better to sleep later and monitoring this position, and place BE after trade has moved?

week18 DJ30 trade outcome - 80 -70,-90 300414

( 2 pos in progress) week14 Dj30 Wr3B from historic high

D1

Price tested historic high and bounced off to form a 3 day bull trap.

week15 DJ30 D1 WR3B 060414

h1

Trade plan will be to get short on retracement.
Best place will be fib5/6/ retracement.

week15 DJ30 h1 interesting gap below 3 day high   battle plan 060414

updated 080414

I thought that this big picture and the setup was great! However I have also come to realize that big picture and trade planning is one thing, modified entry and exit tactics are the ones that determine the trading outcome. Most of the time, trade planning provides a bird eye view of how price may pan out. Entries however, are often far from ideal and I often need to re- adjust my risk reward ratio in order to get in on a great setup.

Yesterday after returning home later than usual from my run, I hit shorts for DJ30 when it just did not retrace to the ideal short price.
Entered when price closed below previous day low .

Hence it is all about adjusting how much position there can be entered. The closer i can enter to the iceline, the more pos i can enter as pip risk is reduced.

DJ30 WR2B retest now with small bullish flag

week4 Dj30 wr2B retest with bullish flag 200114

Dow Jones is obviously trending up on the D1 timeframe.
A Wr2B was completed last week with a obvious upflow, signalling a bear trap.
It has since retrace to the best price at the previous higher low.
Price is now fluctuating within a 3-day bullish flag/ ascending triangle.
Will be great to use this to get in for a longer-term long