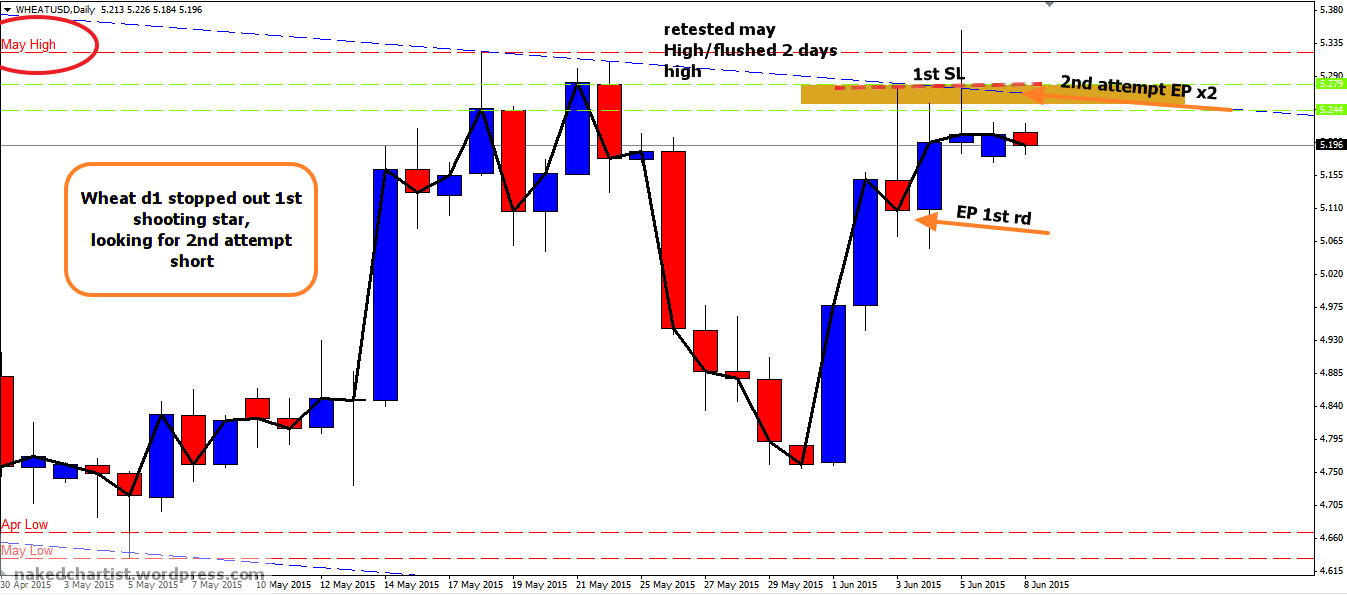
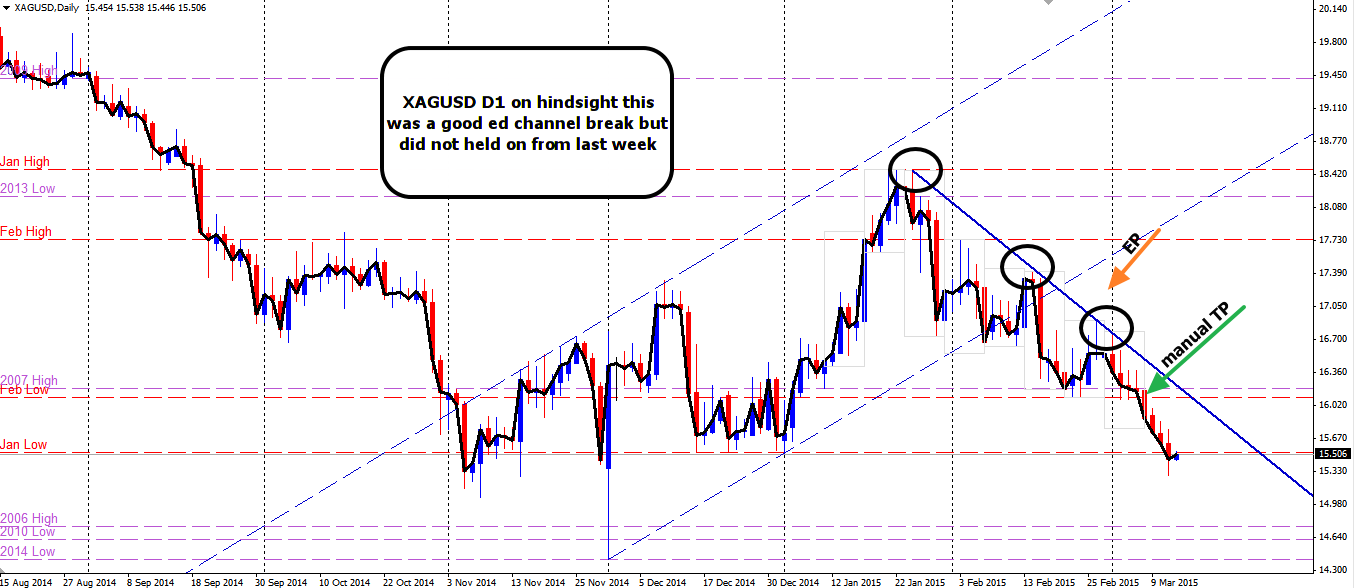
(+100) week26 EURAUD h4 channel bottom with macd divergence done right

D1

Started off with an identification of the trend using zigzag dow theory. Price had completed an inverted head and shoulders
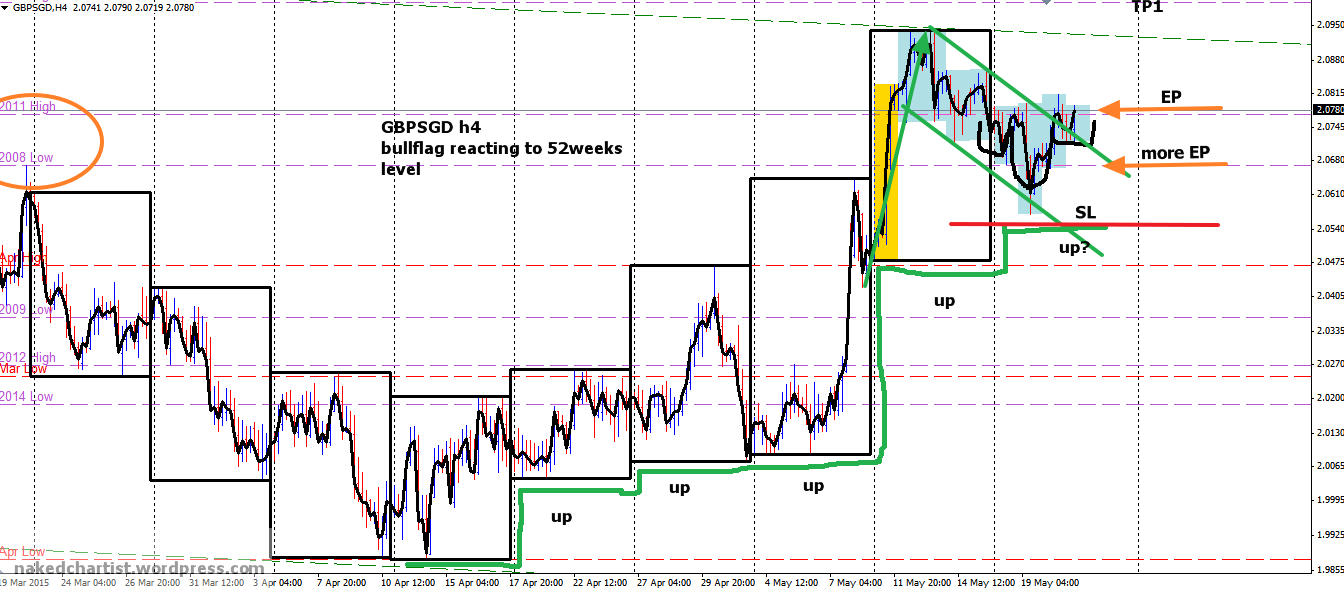
week23 EURAUD D1  6reakout 2 mth high 040615

h4

After several days of no signal for long, finally things began to happen.This was a nice and classic bullflag which I had seen it so many times, again and again. With my strong confidence in the support cluster, I no longer wait for a flush to confirm but will happen the moment i see a bottom. After all , I am only looking for a spurt of 100 pips each. Understanding that price moves in ebbs and flows, each 100 pips always will provide chance for another retracement entry. So in all , I could have traded several times within the story.

week26 EURAUD h4 1234 wr2b 240615

I was willing to add more on retrace, based on the macd divergence i see in the double bottom.

week26 EURAUD h4 wr26 1234 macd divergemce dou6le 6ottom 250615

Outcome 270615

Outcome of this trade has been awesome. This was a good trade as this was a repeated price pattern and my edge continued to work.

week26 EURAUD h1 tp gif 260615

( -200, 2nd attempt sell limit) week24 Wheat looking for 2nd attempt short after stop loss in week23

week23

in week23 , I attempted to short after price printed a shooting star from a channel top.
week23 Wheat D1 shooting star 040615

I was stopped out.

week24 d1

This chart shows a concurrent chart of the stopped out trade. The 1st shooting star failed . On friday, after being flushed, a 2nd shooting star was formed. This time with a better story. I look to short again from a sell limit, with a larger position this time.

week24 Wheat D1 shooting star second attempt short 080615

week22 CHFSGD bearish close below 2 weeks. Looking to short on rally.

D1

Form the day chart , price reacted nicely from the channel top. It can be seen as a large bear flag in progress, although not yet completed. The bearish day close also flushed two months high. Strength was added to this resistance confluence as there were several 52weeks level that were flushed as well, suggesting a huge bulltrap.

week22 CHFSGD D1 bear flag 230515

h4

Looking at the day to day momentum, there was about 10 days of zig-zag down, with several days of bearish day expansion. As last friday saw a bearish day close below 2 weeks low/ 3 days low , I will be looking for a retracement entry in week22 for an entry.

Ideally, there should be some form of level being tested before entering, near ~ 1.4200

week22 CHFSGD h4  d2d momentum 230515

to be updated.

( +20cents) week22 Silver bulltrap over 2 months high, Short from top of ED channel

D1

Month to month, Silver is still downtrend. There is no signs of bullish month expansion yet.

week21 XAGUSD D1 WR2D1B 1234 200515

From the chart, there was a bearish day expansion that flushed the months high. That was the decisive close that caused the swich to bear camp. Noticed how price tend to respect the Equidistant channel top? This is a recurrent price pattern playing out from time to time.

h1

Zoomed into h1 to monitor for test of this 2 mth level as resistance. A shooting star day close will be a very good trigger to short this chart.

week21 XAGUSD h1 waiting for 1234 220515

h1 dilemna

On friday, price did not test the level of 17.40 as I would have best hoped to be. Of course, price is never obliged to come to the level which we have best tactical advantage. More often than not, Entry Point as always about improvisation for me. What was more important was the adjustment of position size to contain the risk. I believe for this setup to be wrong price needs to negate this bearish day expansion, so a logical SL has to be placed there.

week22 XAGUSD h1 dilemna entry 230515

updated 310515

Took profit for this trade. Price went to where I wanted. Although the RRR was not fantastic at 1:1 , this trade eventually closed at a profit.

week23 XAG tp 310515

( +90, +BE ) WEEK21 GBPSGD H4 INVERTED HEAD AND SHOULDERS COMPLETE, READY FOR UPSIDE MOVEMENT.

GBP Pound crosses could be seeing a strong moves in the near future.

w1

week21 GBPSGD w1 bullflag 13TL 210515

A nicely connected bullflag has not yet broken out , but currently price is at the top, on the verge of breaking out.

h4

week21 GBPSGD h4 1234 H4t 210515

Going by personal definition of trend on a week to week (w2w) basis , past 5 weeks have registered higher lows each week. This is advantageous for a swing trader who wishes to earn profits within 1-4 days, since the probability of another upweek is high.

On day to day momentum ( d2d) , tuesday registered a hammer, suggesting that price respected the 52 weeks level. Thereafter a right shoulder was completed, from the line chart version.

That suggested that price is likely to continue from past 5 weeks of trend.

updated 230515

trade outcome +90.

Exited on friday morning after seeing that price was not able to register new highs in the morning. Left pos BE out.

Overall good trade setup, excellment trade management. I may not have gotten the large move correct, but I did well by exiting and managing the risk correctly.

week21 GBPSGD h4 trading outcome +90 230515

(+99 , good trade) week22 USDSGD D1 finds support from 2014 high, ready for upside after retracement.

Since reaching 1.400, price did a strong retracement. It is possible that price has now reached the end of the retracement leg, ready to rejoin the longer term uptrend.

D1 chart no.1

Apologies for the messy chart with a cluster of lines. However all these 52weeks level when placed together conveyed a story.
1- 1.400 was the top due to the cluster of 52 weeks level.
2- Price currently finds a support zone, also due to the cluster of 52weeks level + fib 50% retracement.
In particular 2014 High, provides more eivdence that price is ready to bounce from there.

week22 USDSGD D1 bullflag via 52weeks level with macd divergence 230515

D1 chart no.2

Zooming in, a double bottom seems to have formed, suggesting that this 52 weeks level has been tested twice.
With macd divergence, there is added steel to suggest that price has bottomed out.

Looking at the ed channel, price has also already broken out, with friday’s hammer showing strong respect from 2014 high.

week22 USDSGD D1 hammer from support confluence 230515

h1

It is thus compelling to believe that this chart is bottoming out. Going into h1, a bullflag of sorts can be seen and entry can be immediate when market opens next week.

I do acknowledge that trading with a small 1234 bullflag is akin to “demanding” that price has to break out of the 3 weeks range. This is an action that may require a larger stop loss in order to prove the setup correct.

However the price action towards the 52weeks level is compelling.

week22 USDSGD h1 1234 from boxed in 230515

updated 310515

This is the type of good trades that i want to repeat again and again. TP was done at the identified pivot points.

week23 USDSGD D1  line chart tp +99 310515

( +167) week19 GBPCAD h4t with wr2b bearflag from Resistance confluence A trade

week19 G6pcad h4t wr26 040515

Shorted this when I saw the familiar  Resistance tripartite of 2014 low , channel confluence , together with f6.
There was a WR2B which validated a beartrap. And this reversal pivot was even more meaningfully formed with

a yellow purple expansion combination, which suggests the strength of the resistance.

h4, D+1

price plunged straight for monday and now at neckline. Which presents the next decision to take some or leave to ride for more.

week19 GBPCAD h4 suspected neckline 050515

outcome 090515

week19 GBPCAD h4 nailed the exit level correctly 090515

Indeed price did a drastic turn at the identified partial tp area. I did well to secure the profits.

(+ 20%) # Vard #SGX week12 bear flag from downtrend

D1 Big Picture

Venturing into various Equities market to have more oppoturnities to hit on A Grade Price Action setup.

Vard is a SGX equity that has been on a strong downmove since 2012. It was first identified in week9.

week9 Vard w1 bearish trend 240215

D1 Bear flag setup

With the bearish trend identified , I then looked for a pullback to get entry into. There was a solid Resistance in the form of 2014 Low, that happened to cap this bear flag, hence providing a good SL level.

week9 Vard D1 bear flag 240215

D1 bulltrap trigger

The trigger came in the form of the a bearish engulfing which acted as a bulltrap.

week9 Vard D1 bearish engulfing day 270215

Outcome

3weeks later, exited at 40c for a 25% move. Verdict is that trades can definitely be held longer as I am playing for a downtrend continuation. Good identification of direction and timing overall but exit of the trade could have been better.

I believe this is the first prototype for equities trade that I am applying current forex trading principle onto equities. Although trade duration is much longer, it seems to be more stable as well. I am looking forward to have more success in CFD , so in the future I have more markets at disposal, as my edge lies not in extreme master of a particular fx pair, but rather the repeated use of trading methods based on trend, pullbacks & trigger.

Hence a plethora of markets should serve me better.

What I need to do next is to find out what happens if there are issues of counters suspension which may affect CFD trading.

week13 Vard D1 exited due to strong FOMC movement 190315

week12 Newcrest Mining, on a downhill slide with huge bearflag

Met up with old army friends over the weekend and the topic of stocks came up. My friend shared that he was owning Newcrest Mining , #ASX and therefore I was curious about all stocks.

Monthly

Looking at the 52weeks levels, I am taking that the current downfall might be good if it falls below 2014 Low , causing whatever is above to be a bulltrap.

week12 newcrest mining 52w levels 140315

Weekly

on first glance it looked like a small accumulation pattern. However, to be more in aligned with dow theory of LH LL, I will seeing it as a bear flag.

week12 Newcrest mining w1 bearflag 140315

week12 newcrest mining  d1 Wr2B Dt alrdy completed 140315

week11 XAGUSD Ed channel review

D1

This was a great ED channel break on hindsight and I had excellent right at the top of hair entries with double positions but let the 2nd one go too fast on hindsight. Price plunged subsequently.

Once in a while, cor relational play might not have worked too well.

week11 XAGUSD hindsight excellent entry 120315