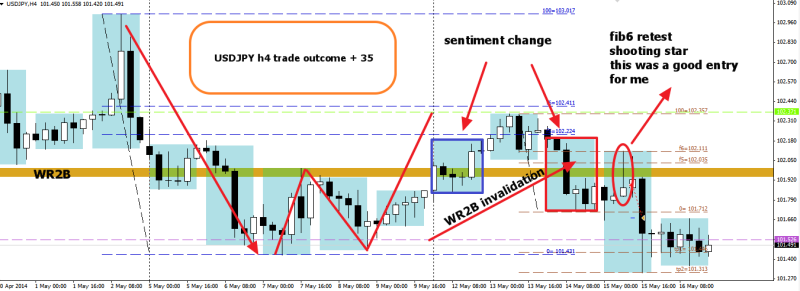
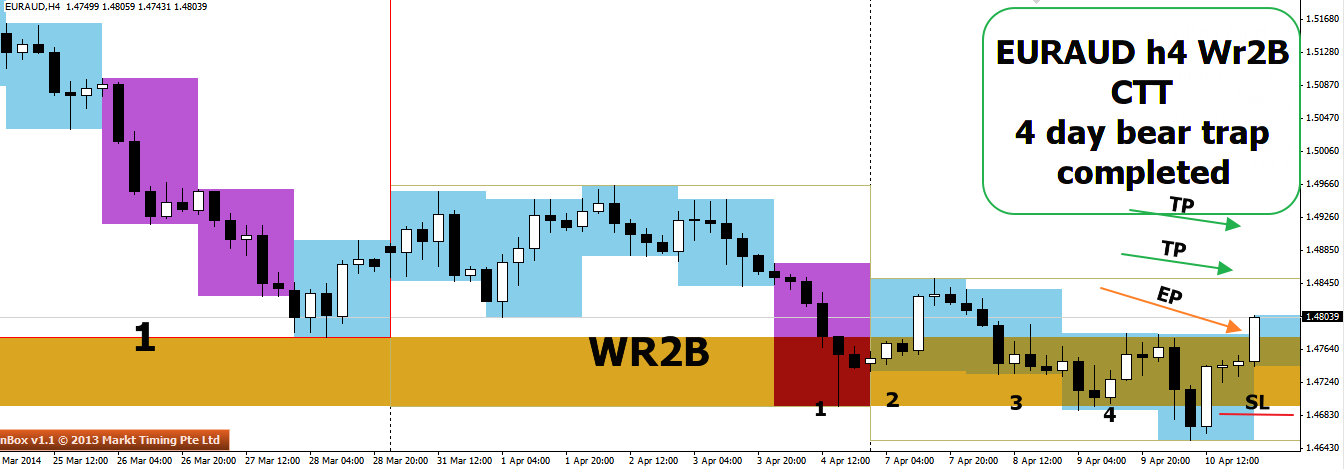
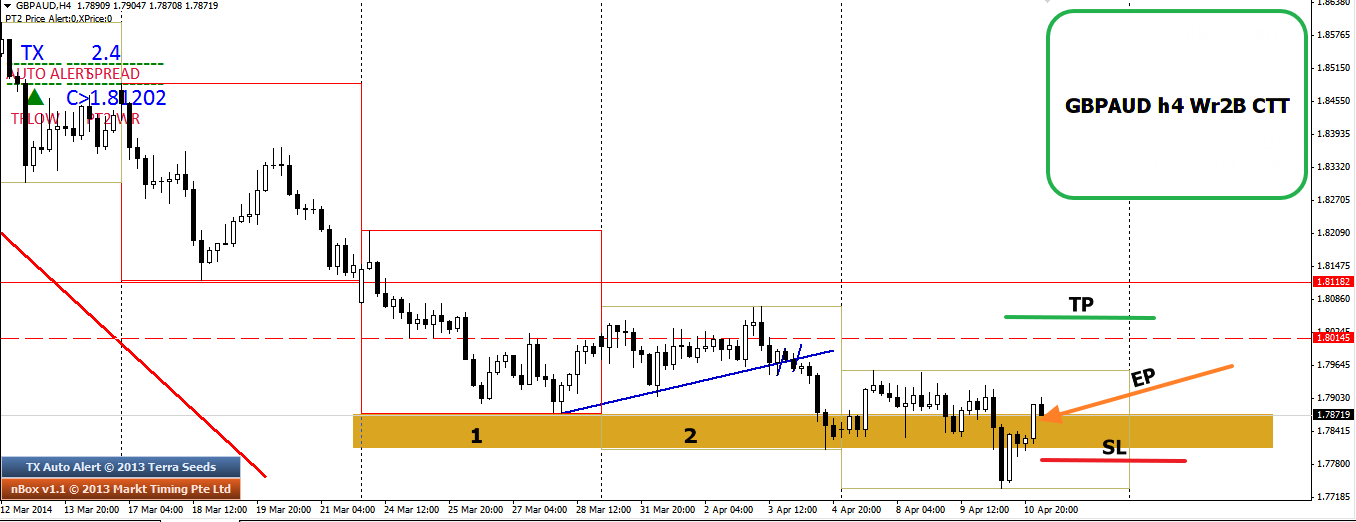
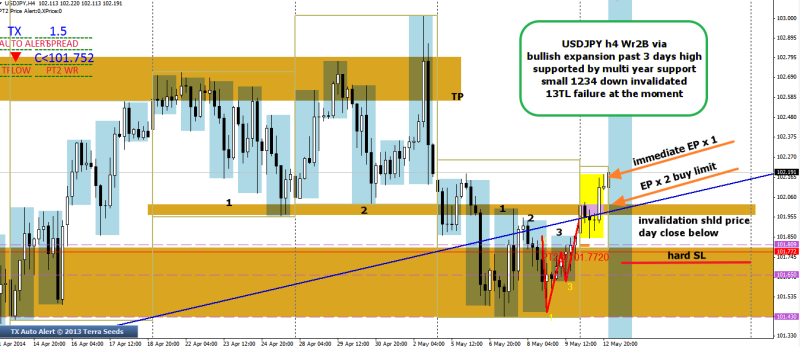
(-80, +180 , +210, last big pos running) week6 GBPSGD A trade 1234 with multiday bullflag with macd divergence from Strong S from 52weeks level

This is the way trading should go for me.

My progression of thoughts
D1

First caught my attention with this big picture.

week6 GBPSGD D1 TL flip 010215

h1 trading tactics

At first i entered on monday but was SL-ed from the WASH leg

week6 GBPSGD h1 multiday 1234 divergence 030215

the real A trade setup

it was only by Wednesday that the setup appeared and i was convinced to hit bigger this time on entry. I could not see any more consolidation as I had seen everything that I believe that the price will move in my favour.
I was happy that I hit harder in entry for the 2nd time after i was initially stopped out.
I do admit that perhaps the better way to trade will be to wait for a flush to be completed first.
week6 GBPSGD 1234 multiday ihs divergence 040215


Outcome

outcome was that the inverted hns identified was indeed powerful and after close to 8 months of documentation I will say I am finally satisfied with what I deemed to be as ‘A trade’. I grow confidence with every documentation and with every successful A trade setup that we make.

It is time i revive the A trade project and redefine something

week6 GBPSGD h1 trade outcome  -80 +180 +220 080215

(+40) week39 USDCAD h1 1234 macd divergence with ranging conditions

D1 big picture

The big picture showed mixed bias but overall if I were to go for long it would be from a strong support confluence.

week39 USDCAD D1 big picture with boxes 210914

h1 moveability

from h1 I did not trade at the right shoulder which I had anticipated but I jumped long for a small position when another trading group alerted to this setup. Exited at 40 pips eventually at f6.

(+35) week34 USDSGD a countertrend using flying buddha n EWUS

h1
Bias for long first came when I saw this channel with nice macd divergence. From here I identify this as a countertrend channel.

week34 USDSGD h1 leontey 160814

D1

I did this chart in 4m and my moot for support is that it is lying on 3 months low support and is currently f6, which makes this an EWUS play. Thus this confluence of support strengthened my belief for a countertrend long.

week34 USDSGD D1 price at 3 months low 190814

D1 trade outcome

However through this process I had to endure 3 days of OTM as my entry was speculative and experimental. I did not feel good about holding this trade as I was not LOBSOW entry and on hindsight it was more of speculative. My TP was abtout 1.2492 , as 1.2500 was nice round number and also the f5 res + potential right shoulder.

From hindsight I also see that there was 2 days of flyinh buddha.

week34 USDSGD d1 trade outcome +35 200814

h1

On hindsight I would like to internalize from this chart that price is probably doing a base building for past 3 days , since I see 3 days of flat boxes. There is no classic shape of an ed channel so I need to bring balls and go LOBSOW at fib6. This is how it should be seen and should the next type of setup appear, I will need to take the right action.

week34 USDSGD h1 bull bear tussle 190814

( $1, $2) week24 WTI d1 hammer @ strong fib support and flushes 6 day high

D1

This was really a smooth and easy trade. The strong hammer from a confluence of fib n line chart support helped me decided on a clear bullish bias.
The issue was how much position can I load up. I had more buy limit at lower price but sadly subsequent positions were not filled and hence it was only a small position that eventually made it to the TP level.

I will also like to highlight on the use of mean reversion when I noticed that price had been overextended on d1 EMA. This should be A trade but sadly my larger positions were staked in another pair, which did not work out.

week24 wti d1 hammer profit taken +1 +2 100614

( +35 good and fast trade) Week20 usdjpy wR2b ranging long via 3 day bullish expansion has zig zag pattern

h4

this pair completed a wr2b ranging via a bullish expansion day over 3 day high.
this bullish expansion can also mean a smaller accumulative pattern has been completed and price is now charging out of this consolidation.
This consolidation is perhaps due to support being found on multi year support + 13TL failure.

Any retracement is a short but a day close below this level invalidates this long trade.

I am expecting it to hit the box high.
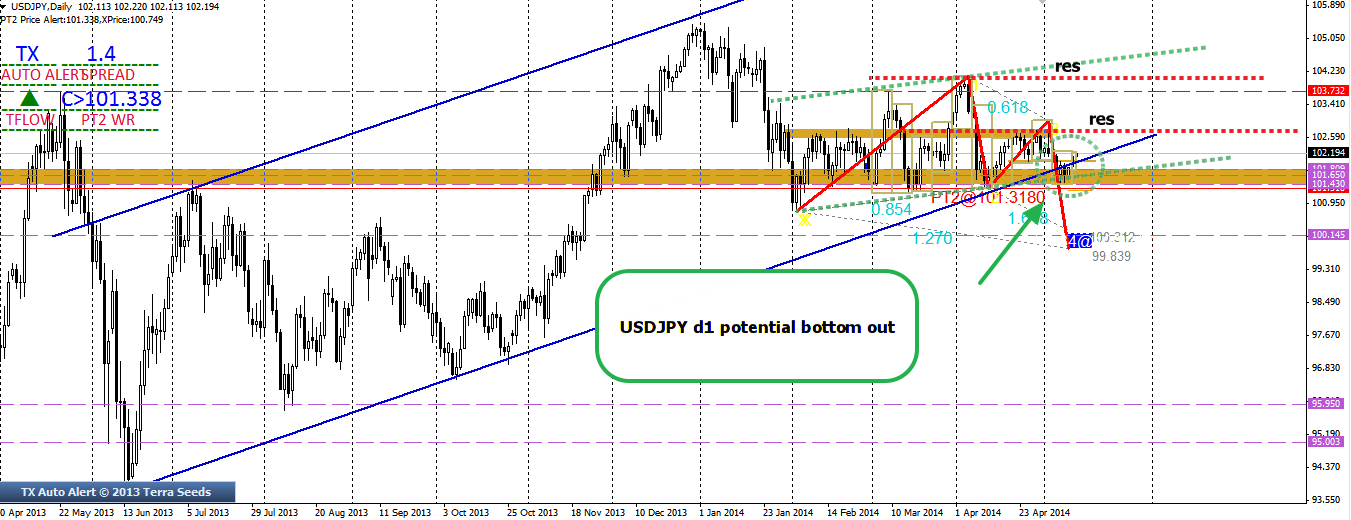
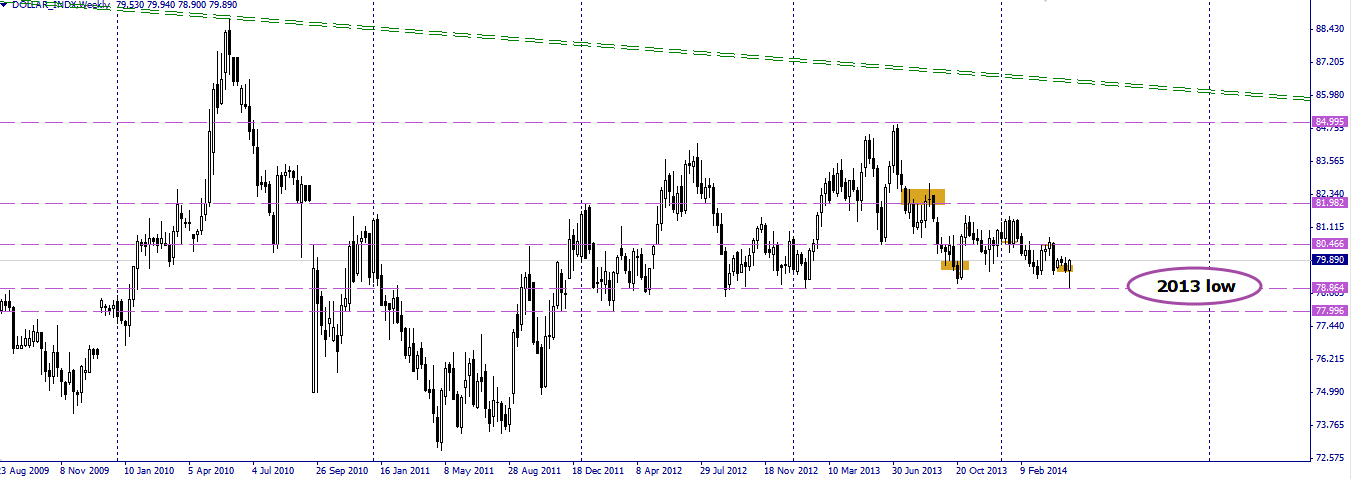
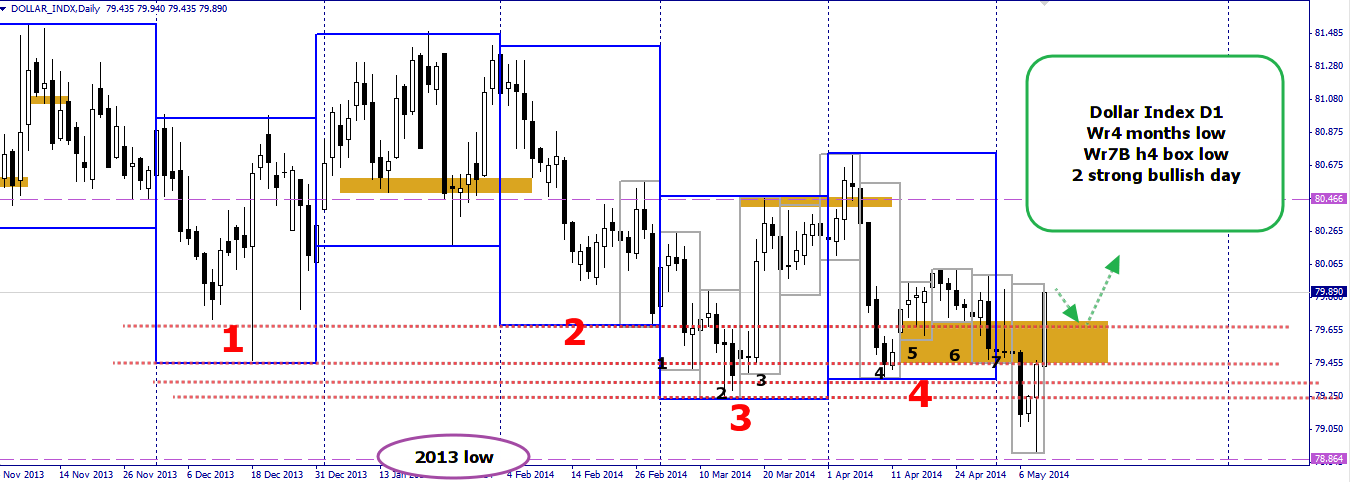
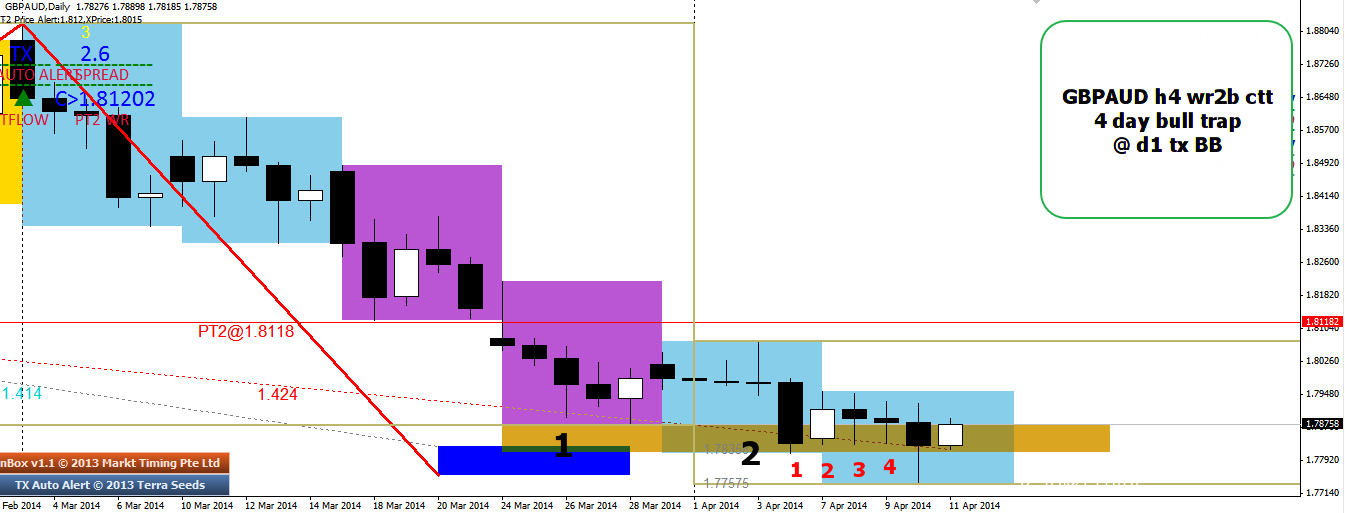
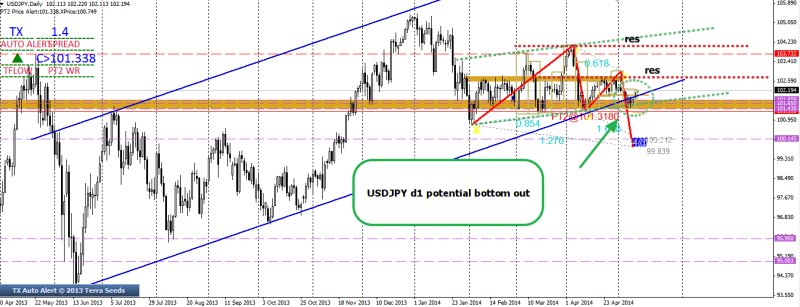
week20 USDJPY wr2b completion via 3 day bullish expansion 130514

d1

From the big picture, several things are suggested:

1- as from zig-zag pattern hypothesis, these patterns are usually formed when a head and shoulder pattern is completed and can be used to denote ‘stepping down’ action. However in this case this pattern seems to be having difficulty in being completed, at least for now.
So does failure of hns completion @ neckline = potential for higher move up?

2- the bottoming out is suggested by sentiment change in d1 candlesticks when a bearish expansion day charging into the multi year support turns into a bullish expansion bar after a few days. This screams bear trap. When aligned with big picture- it therefore suggests that 13TL is a failure , multi year levels holds as a support.

3- A long from here , suggests long entry is an early entry and has room for movement. Levels to watch will be 1: range high 2: Ed channel high

4- I can convert this strength in USDJPY to other crosses i.e AUDJPY , NZDJPY and continue to hold other crosses with confidence.

week20 usdjpy d1 big picture potential bottoming out 130514

however, due to an overloading of positions already, and wanting to save margin for later part of the week for the best trade setup with highest edge, I am refraining from entering a large position.
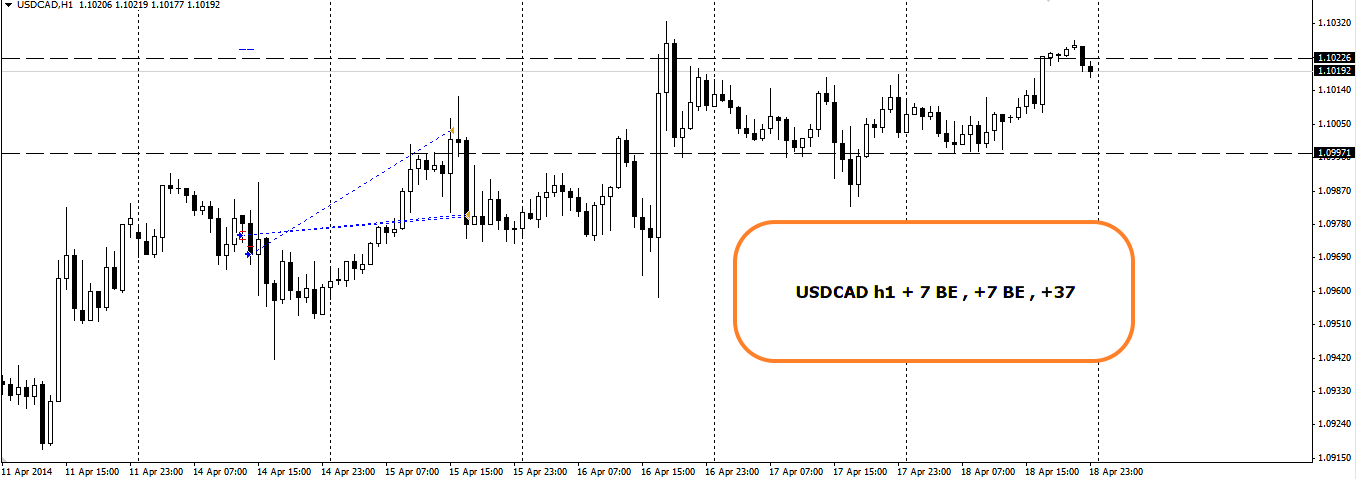
updated 170514

trade outcome +35

Another satisfying trade, as size was considerable for me and trade moved quickly and was exited quickly. I am working towards banking in profits quickly in this manner. For me, it is not really important to see how trade can last and if it is ” over 100+ pips+ or not.
Because when conviction is high for a trade and big positions are entered for a trade idea, pips does not matter that much more. It is more about trade moveability and how long I can exit this trade to book my profit, release the margin and move on to another trade.

Hence my mindset has begun to shift, which i thought had been effective since i have been booking profits more often with much lesser losses recently. Clearly, this strategy is working, contrary to what popular trading literature might have argued otherwise.

Good trade criteria to begin with
However, there were extremely good signals to begin with.
– blue to red expansion box indicate sentiment change
– this turn was due to df fib5 n fib6
– Also invalidation of a previous wr2b up
– upon retracement of this downflow towards fib6 was a shooting star, hit the trade.

week20 USDJPY h4 shooting star entry trade outcome +32 170514

Week20 Dollar index supported @ 2013 low forming major Wash and rinse

W1

Price hit 2013 52 weeks low. Support indicated by a d1 bullish hammer. Subsequent friday close confirmed a bullish hammer.

week20 Dollar index w1  52weeks low big picture 110514

D1

With this bullush close, a WR of 4 months low and Wr7B is formed. On next week, I will be looking for retracement, before playing off Dollar strength. I.e gbpusd , nzdusd , eurusd.
My conviction for gbpusd short has increased.

week20 Dollar index D1 Wr4d1b wr7b 110514

week20 Dollar index D1 Wr4d1b wr7b 110514

week18 XAGUSD Support at 2014 low WR4B pending h1 1234

My initial thoughts on metals correlating with dow , snp indices , as well as jpy crosses are that they reflected risk on/off sentiments. So last thursday it happens that metals were up , jpy crosses and indices were down. In this case, it seems that all 3 groups happened to correlate and all point to a possible risk-off sentiment for the market.

D1

Price tested 2014 Jan low and was supported by Day close
Note that there was a previous 1234 which seemed to have failed.

week18 XAGUSD D1 still supported by 2014 low 280414

h4

Last week, there was strong hammer which caught everyone by surprise. On day close, it became a bullish hammer which closed above 4 weeks low and engulfed 5 day candlesticks.

week18 XAGUSD WR4B CTT with 5 day engulfing 280414

h1

On h1 a 1234 can be seen, monitoring to see if solid pt4 can be formed at w1 level, and hopefully this consolidation can setup to be a potential 2 x h1 bear trap 1234.

week18 XAGUSD h1 trade plan 280414

A trade checklist

to be tabulated , KIV

(rd2: waiting for week17 retracement)( +37 , +7,+7) week16 USDCAD w1 Wr2D1B with a hammer

w1

On higher timeframe, USDCAD is still up. upon a bear trap of 2 months high via a w1 hammer,
I am looking for price to continue up. No setup yet but entered long on a retracement on monday.

week16 USDCAD w1 Wr2d1b with hammer 150414

updated 200414

reason for exit was not strong. Had it reached a key level? Was there a very bearish signal?

Early exit was not right, but considering one of the protocol was quick exit for fairly poor entry, then this action may be acceptable.

week16 USDCAD trade outcome +7 BE + 37 200414

trend is still up though.
looking at the recent upmove, price is perhaps wishing to test fib5. perhaps still 40-50 pips of movement.

week17 USDCAD D1 still up till fib5 200414

week15 ( -35 x 2) EURAUD and ( -35 x 2) GBPAUD h4 bull trap Wr2B CTT

EURAUD h4

4 day bear trap and wr2b

it was 6am when i was up and noticed the 4 day bear trap. However i did not enter and lost out on 60 pips.

thereafter wr2b came at 9am close and i entered at that time.

week15 EURAUD wr2b ctt h4 with 4 day bear trap 110414

GBPAUD h4

week15 GBPAUD h4 wr2b ctt 4 day bear trap  EP 110414

D1

on d1 , price also supported by tx d1 Blue Box

this is not the best of setup, but this is the type of setups that i have been trading for the past year. not the A trade setup, but most of the time if I am not greedy, trade is likely to reach target level.
week15 GBPAUD h4 wr2b CTT 4 day bear trap 110414

updated 120414

GBPAUD h4 cut loss -35 x 2

week15 GBPAUD h4 wr2b ctt -35 x 2 cut loss 120414

EURAUD h4 cut loss ~-35 x 2
week15 EURAUD h4 wr2b ctt -35  120414

I manually pulled out of the ctt longs after a bearish h4 candlestick. In summary, I was trying to front run the market, which i should not have.

On few reasons:

1) yes , although there was the presence of WR2B and multi days bull traps, there was no key support to be found.

2) I did not seek to minimize pip risk by trying to get price when it tried to retrace.

3) With all these aspects pointing to a poorly crafted counter trend trade, I should have waited for at least a h1 bullish expansion before deciding to trade for long. At least a prior upflow first.

I need to be aware of this mindtrap, which comes especially after a fluid n flowing early week with most counters moving. This impression tend to linger on and may affect subsequent trades, luring the mind into thinking that whatever trades taken will move fast n furious.

In my euphoria, I have also forgotten to minimize pip risk of counter trend trades.

The positives which I had done in these trades was early exit with some pip loss and a reduced position for counter trend trades.